
Global Venture Capital Contracted 72% Between May 2025 and May 2026 — But the UAE Collected Eightfold More Capital in the Same Period
The first five months of 2025 recorded $96 billion across nearly 21,000 rounds, and the same five months of 2026 produced $26.7 billion across approximately 460, a difference that cannot be read as a straightforward year-on-year decline because the datasets differ in scope and coverage, but whose structural divergences are real enough to constitute a genuine shift in where and how capital was deployed.
Private equity-backed late-stage activity defined the 2025 allocation; early-stage equity defined 2026. Defence and military AI absorbed the largest single-vertical dollars in 2026, while HPC infrastructure and datacentre buildout held that position in 2025. The UAE collected eightfold more capital in the 2026 window than in the 2025 window, while India contracted from $5.08 billion to $960 million, and the rest of MENA outside Dubai shrank across all tracked markets.
The 2025 Baseline Was a PE-Driven Market That 2026 Has Not Replicated
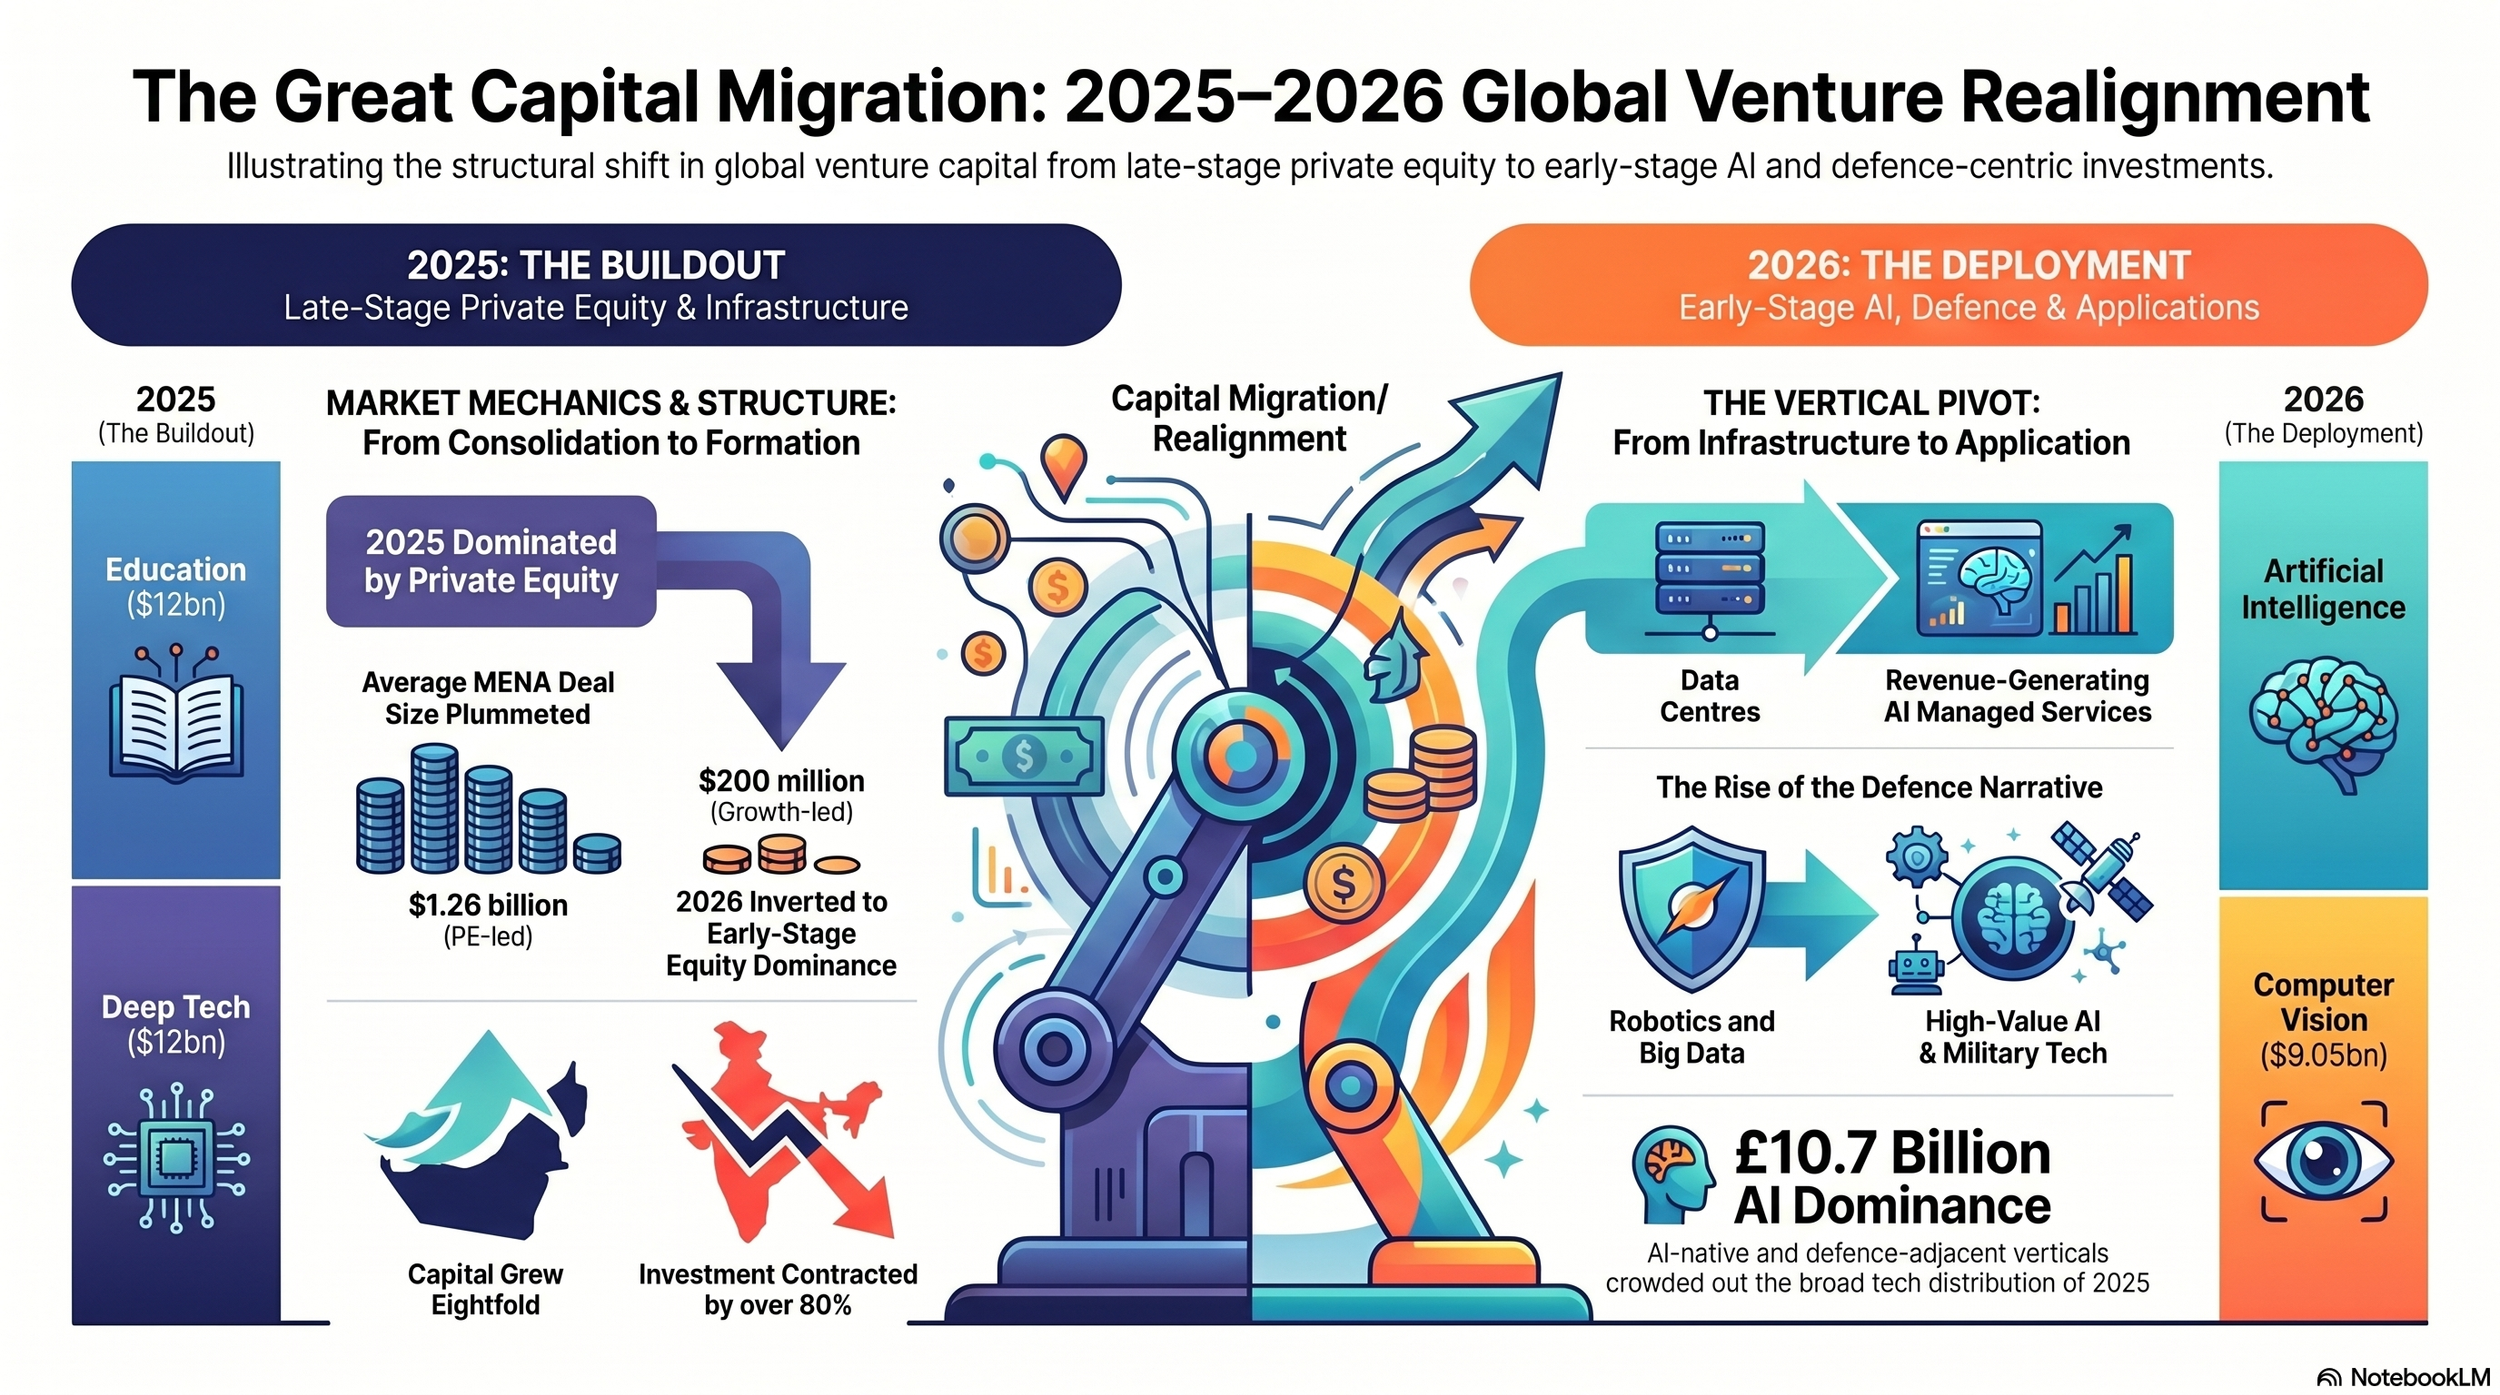
The stage breakdown is where the 2025 to 2026 shift is most legible, because it reveals that the contraction in total dollars reflects a withdrawal of the instruments that generated the largest cheques rather than a broad retreat from venture activity. In the January to May 2025 window, private equity dominated the global funding stack by dollar volume, accounting for the largest single band in the stage composition data, with late-stage equity following at a distance and early-stage and seed rounds contributing volume by count but relatively little to the total dollar figure. Average deal sizes ran accordingly high, with the average MENA round reaching $1.26 billion in 2025, a number anchored entirely by PE activity at the top of the market and not representative of the underlying formation-stage deals happening below it.
By the equivalent period in 2026, that composition had inverted: early-stage rounds dominated both count and weight, PE's share compressed substantially, and the average MENA deal settled closer to $200 million, still large in absolute terms but a structurally different figure that reflects growth equity rather than institutional buyout capital. The 2026 market was not simply smaller than 2025 but organised around a different logic: more formation capital and less consolidation capital, fewer large-ticket instruments, and significantly greater concentration in a narrow band of high-conviction verticals that the prior year's data had not yet elevated to prominence.
The disruptive waves data make that vertical concentration visible in precise dollar terms. Sustainability led the 2025 waves allocation at $2.35 billion, with vertical SaaS at $1.53 billion, blockchain infrastructure at $555 million, AI at $460 million, IoT at $320 million, industrial robotics at $172 million, and Big Data at $43.5 million, a broad distribution of capital across categories that had been attracting investor attention for several years.
By May 2026, sustainability had contracted to $1.24 billion, vertical SaaS to $617 million, blockchain to $401 million, AI to $365 million, and IoT to $298 million, while industrial robotics collapsed to $4.6 million and Big Data registered essentially nothing, figures that do not describe declining industries so much as categories whose investment label lost its appeal as the narrative reorganised itself around AI.
Robotics capital migrated into autonomous systems and defence applications, where it attracted orders of magnitude more institutional attention under a different name. Big Data was absorbed into AI infrastructure as a vocabulary and into hyperscaler spending as a commercial reality. Sustainability capital did not disappear either, but its destination shifted: energy infrastructure drew $3.17 billion in the 2026 offline sector data, repackaged as the power layer beneath the AI compute buildout rather than as a climate investment, which means the money continued flowing to similar physical assets but was motivated by a different urgency and reported under a different thesis.
The feed-level data shows where the capital that left those categories went. In 2026, artificial intelligence as a broad category recorded $10.7 billion, computer vision $9.05 billion, AI-native companies $5.18 billion, drones $5.17 billion, military tech $5.01 billion, enterprise software $5 billion, SaaS $4.73 billion, and AI infrastructure $4.55 billion, a top tier dominated almost entirely by AI-adjacent or defence-adjacent verticals. In 2025, the leading feed categories were education and deep tech at approximately $12 billion each, followed by enterprise software at $8 billion and SaaS at $7.5 billion, with AI featuring at roughly $5 billion but alongside a broader spread of categories that shared the top tier rather than being crowded out by it.
The trending themes confirm the character of that shift with particular precision. In 2025, the two leading trending categories were HPC as a service at $2.82 billion and datacentre colocation at $2.23 billion, which together describe capital flowing into the infrastructure layer beneath the AI buildout, complemented by AI coding assistance at $930 million, cross-platform development at $928 million, hyperlocal delivery at $901 million, food delivery at $900 million, and generative AI for SMBs at $611 million.
By 2026, those categories had been replaced by managed services and event contracting at $5 billion each, real money gaming and conversational AI at $1.2 billion apiece, chatbot and contact centre AI at $953 million each, and microgrid infrastructure at $950 million, a collection of themes that points to AI deployed in revenue-generating applications and to energy secured for the compute layer rather than the compute layer being built in the first place.
United States: What It Won, What It Replaced, and What It Let Go
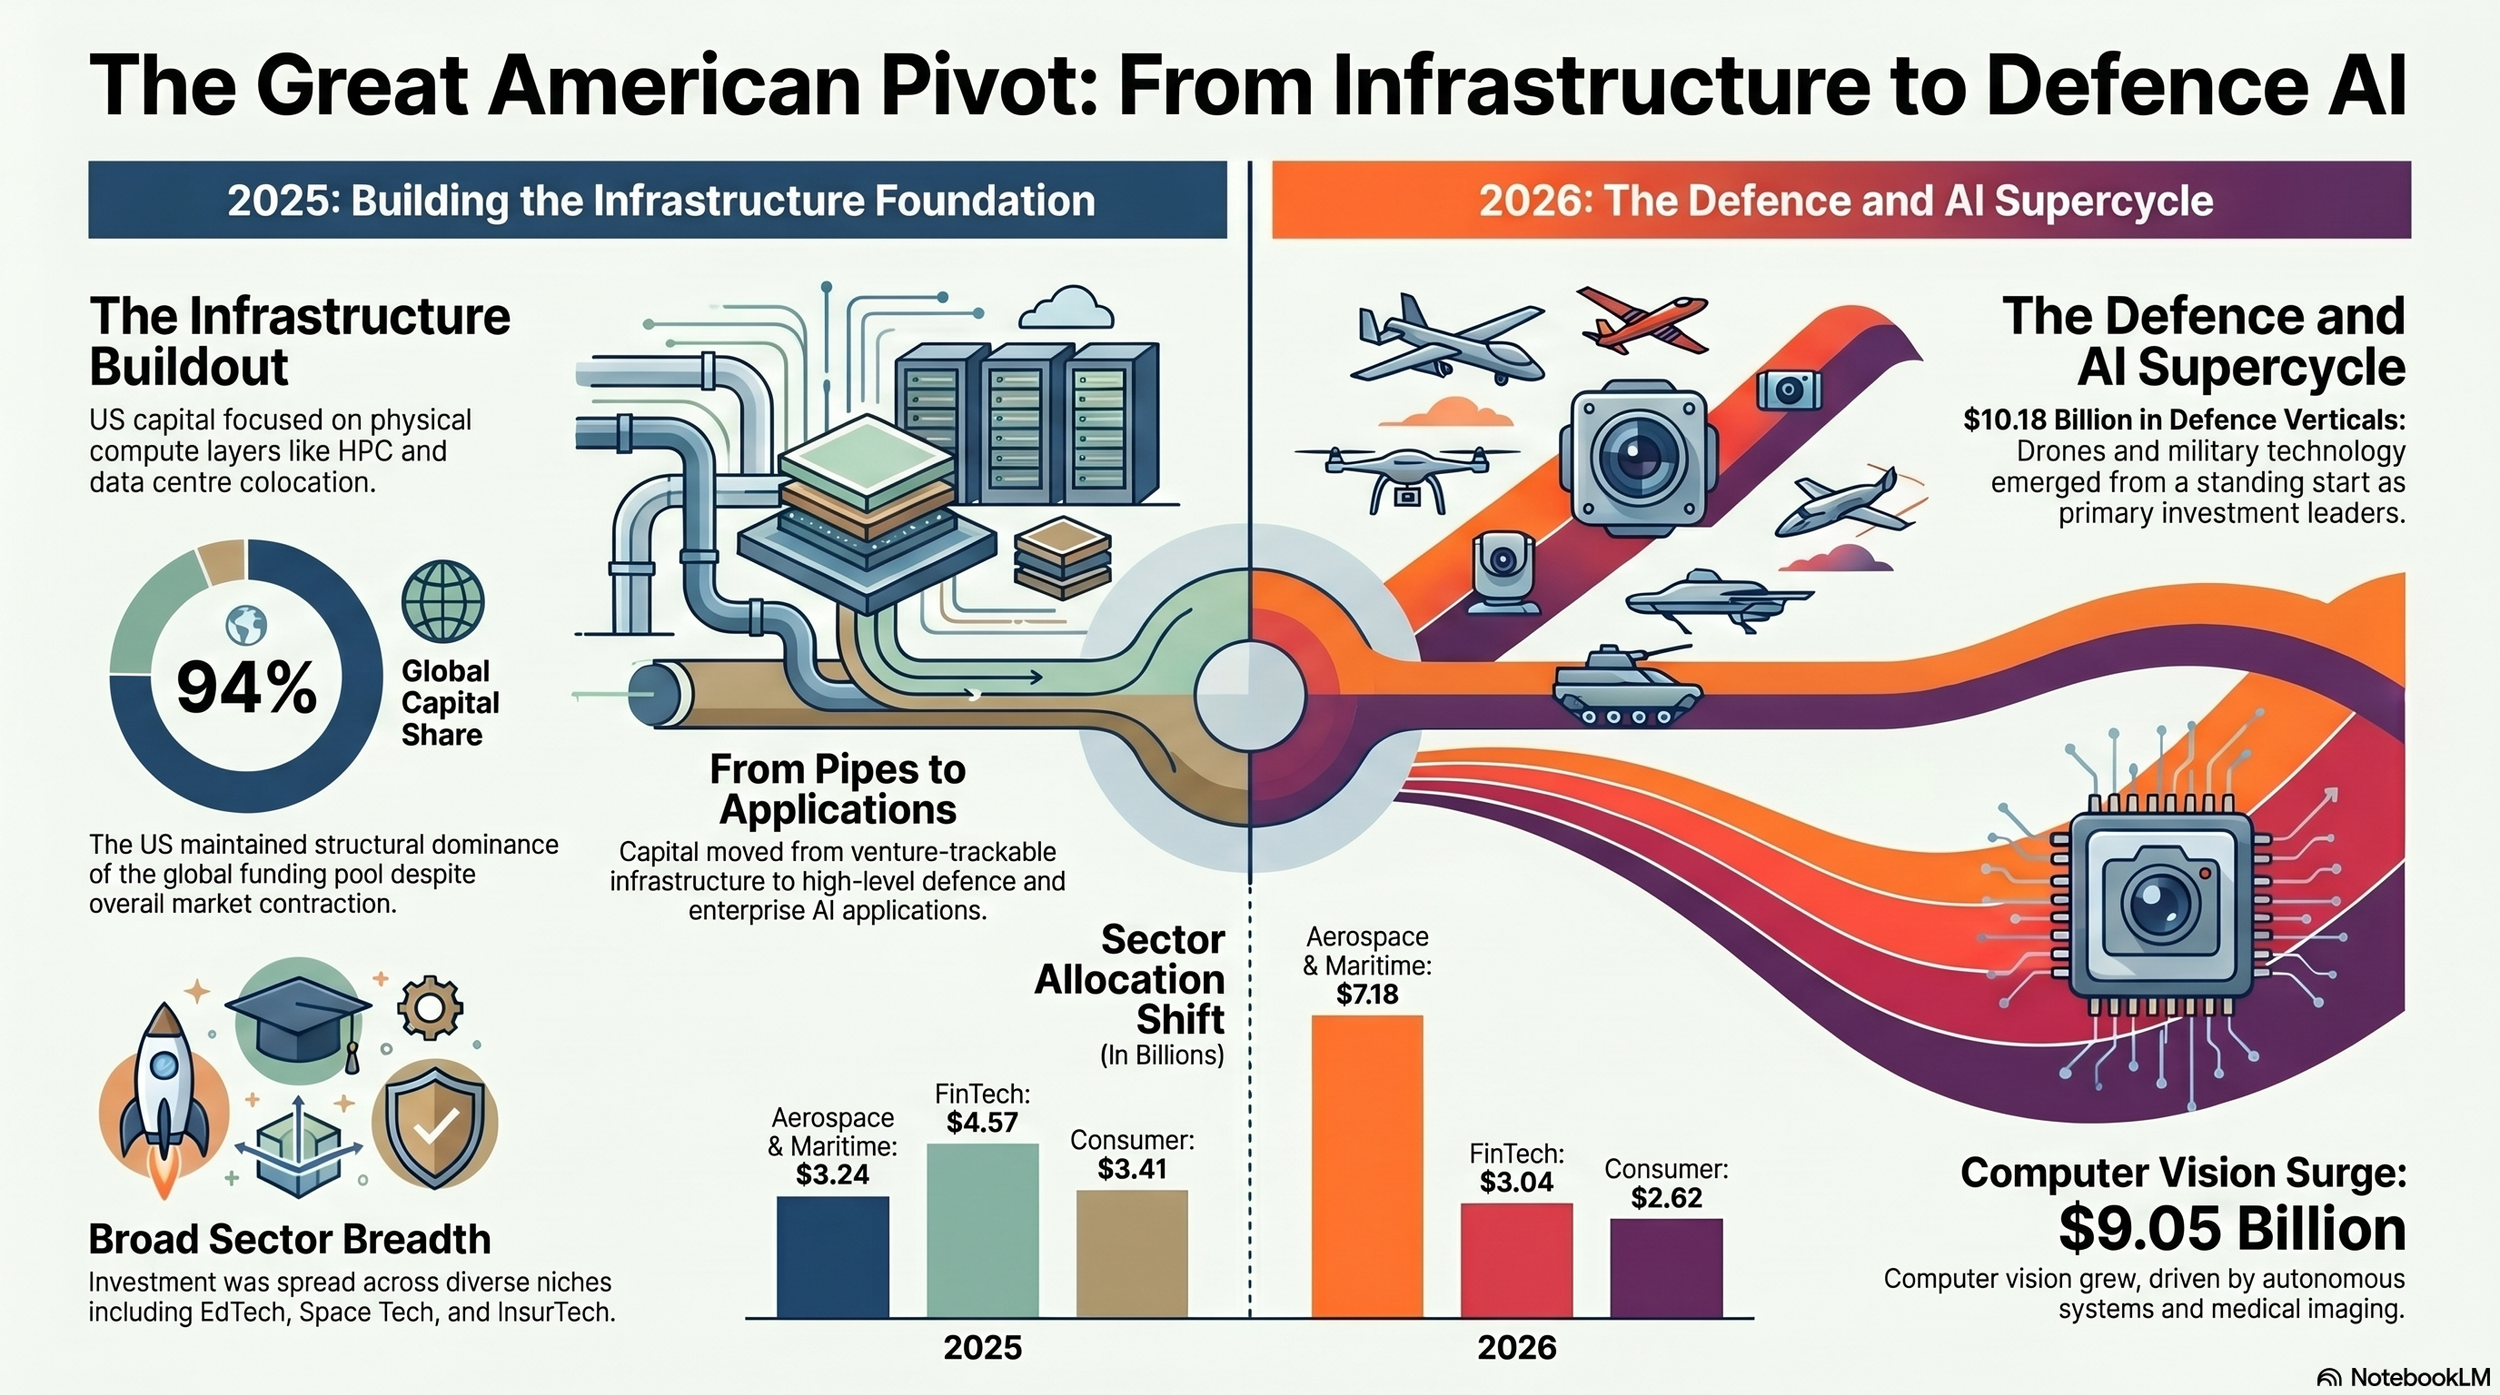
The United States registered $89.8 billion in the 2025 snapshot and $25 billion in the 2026 equivalent and, given the overall contraction in the dataset, maintained its share of roughly 94% of tracked global capital in both periods, meaning the reduction is in the total pool rather than in the American share of it. The country's dominance of the global funding distribution is not a 2026 development but a structural feature of the data that has not changed between the two windows; what changed was the sector allocation within that share and the instruments used to deploy it.
What the US won in 2026 was the defence-and-AI supercycle, which had no equivalent in the 2025 trend data. Drones at $5.17 billion and military tech at $5.01 billion appeared from a standing start as two of the largest single verticals in the tracked global data, and computer vision at $9.05 billion grew substantially as autonomous systems, medical imaging, and defence applications expanded the category beyond its 2025 scope. Enterprise software and SaaS maintained their positions at $5 billion and $4.73 billion, respectively, sectors where 2025 had shown comparable strength, providing continuity in the platform layer beneath the AI application stack.
What the US replaced was the infrastructure buildout story that had defined the 2025 trending data. HPC as a service and data centre colocation were the 2025 trending leaders at a combined $5.05 billion, describing capital flowing into the physical compute layer that the AI application wave required, but those categories do not feature prominently in the 2026 trending data because hyperscaler capital expenditure absorbed that function and removed it from the venture-trackable market. The buildout moved off the venture balance sheet and onto the balance sheets of Microsoft, Google, and Amazon, leaving the venture market to fund the applications rather than the pipes.
According to the data, the US lost the sector breadth that characterised the 2025 allocation. Education and edtech featured among the top-tier 2025 feed categories and registered negligible venture activity by 2026. Space tech appeared as a meaningful mid-tier category in 2025 but was excluded from the 2026 headline data. Generative AI for SMBs drew $611 million in 2025, per trend data, while the 2026 equivalent registered $400 million in generative AI solutions broadly, suggesting the SMB tooling thesis compressed even as enterprise AI spending accelerated.
InsurTech attracted $2.46 billion in 2025 tech sector data and holds no comparable position in the 2026 breakdown, a contraction that suggests a market in which insurance technology stopped being treated as a distinct investment category and began to be absorbed into broader fintech or enterprise software theses.
The tech sector comparison sharpens the picture across the full distribution. In 2025, the US-led global sector allocation showed applications at $10.8 billion, high tech at $9.67 billion, FinTech at $4.57 billion, conglomerates at $3.54 billion, consumer at $3.41 billion, and aerospace at $3.24 billion, a spread across consumer, enterprise, and infrastructure categories that reflected the PE-driven market's appetite for diversified platform exposure.
By 2026, aerospace and maritime categories had jumped to $7.18 billion as the second-largest allocation globally, while FinTech contracted to $3.04 billion, consumer to $2.62 billion, and conglomerates effectively disappeared as a category, meaning the market that funded diversified platform companies and insurance technology in 2025 was funding military aerospace and autonomous systems in 2026.
MENA: The UAE Rewrote the Regional Ledger While the Rest Contracted
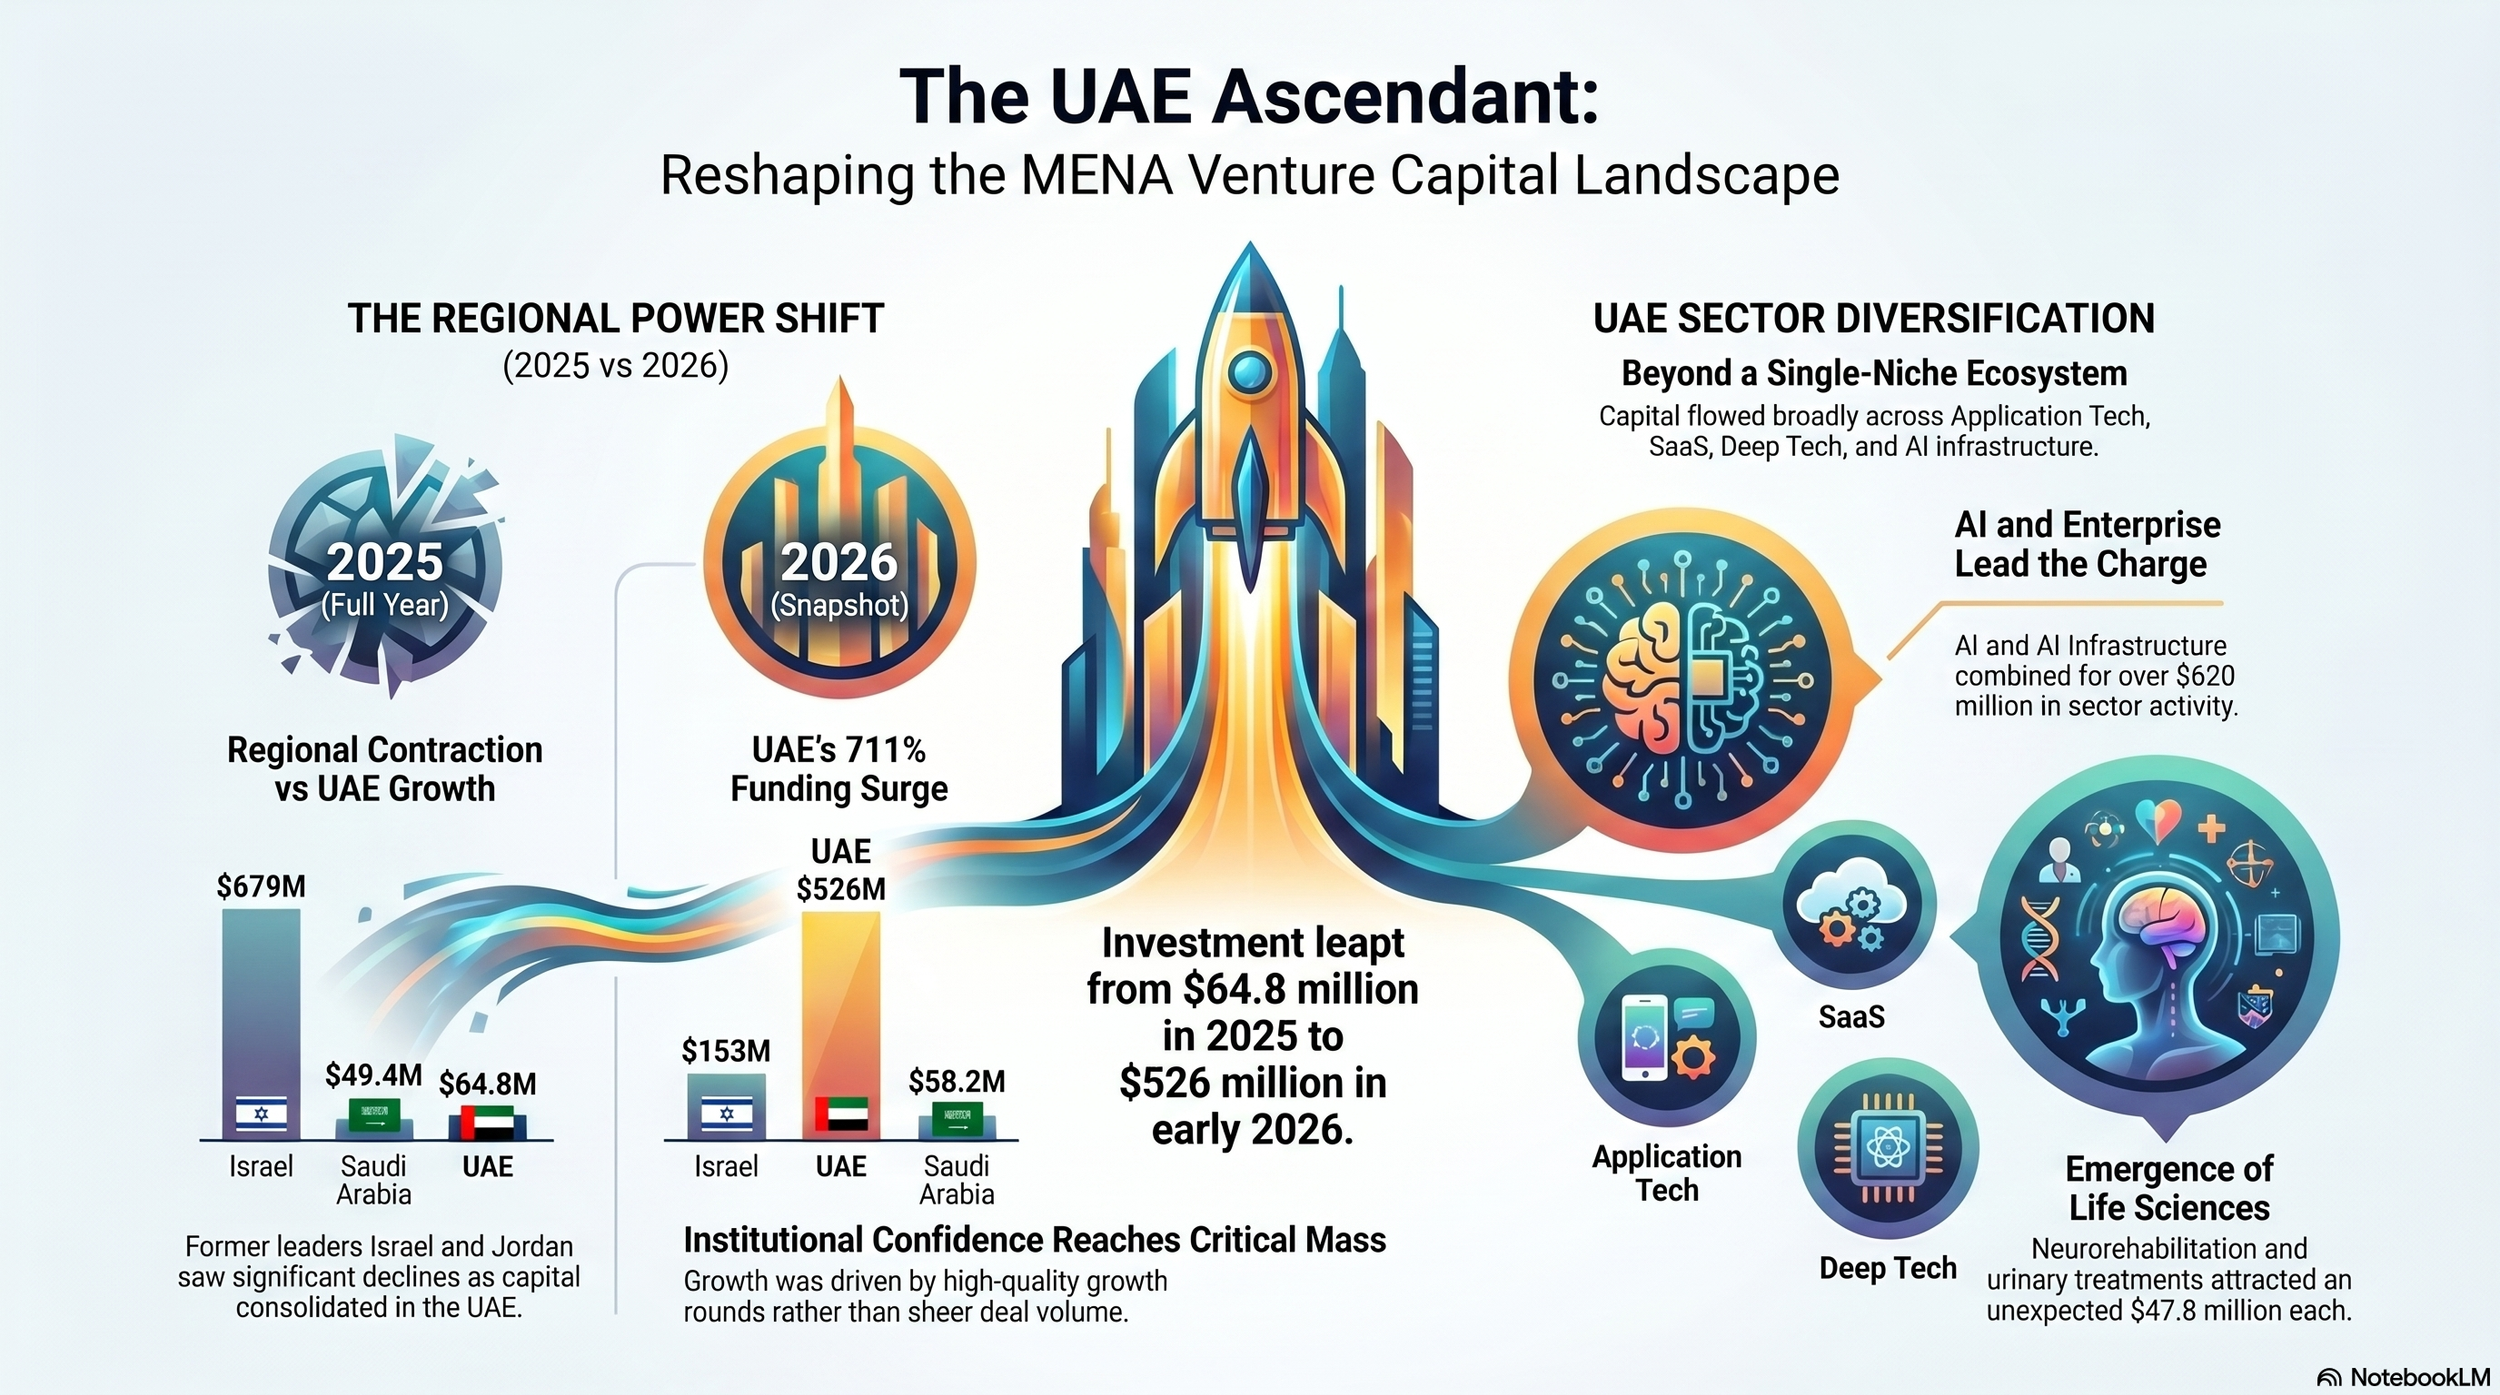
MENA recorded $783 million across approximately 25 rounds in the 2026 snapshot, against a regional total in 2025 where Israel led at $679 million, Jordan contributed $250 million, Egypt $122 million, Saudi Arabia $49.4 million, and the UAE $64.8 million, a distribution that placed the Emirates last among the Gulf states and sixth in the global country rankings behind the United States, India, Israel, Jordan, and Egypt.
The 2026 data reversed that order entirely, with the UAE leading MENA at $526 million, Israel falling to $153 million, Saudi Arabia holding at $58.2 million, and Egypt contracting to $45 million.
The UAE's movement from $64.8 million in the full 2025 window to $526 million in five months of 2026 is the most anomalous data point in the entire comparison, and the sector breakdown confirms it was broad-based rather than driven by a single outlier transaction.
Application tech led at $441 million, SaaS at $426 million, deep tech at $319 million, AI at $311 million, and AI infrastructure at $310 million, a distribution across at least five distinct categories with meaningful dollar values that point to genuine ecosystem activity rather than one anomalous raise inflating the headline number.
The UAE did not win a lottery during this period; it appears to have reached a threshold at which institutional investor confidence and deal flow have achieved critical mass simultaneously.
The round structure supports that reading, with MENA's 2026 stage breakdown weighted toward early and growth-stage equity and a meaningful component of debt funding contributing to the total dollar figure, while average round size for the UAE and Saudi combined ran above $200 million, a figure skewed by a small number of larger transactions rather than representative of a broad mid-market. The underlying deal count remains thin at approximately 25 rounds for the whole region, which means the per-round average describes a handful of high-quality company formations and growth rounds landing in a market that has built sufficient credibility with institutional investors to attract them, rather than the kind of volume that would signal a fully developed venture ecosystem.
What MENA won in 2026 was the UAE's emergence as a genuine venture destination for AI and enterprise capital, with the sector spread confirming that the country is attracting investment across application, infrastructure, and deep tech categories rather than in a single niche. What it lost was the breadth that had characterised even the modest 2025 regional total. Jordan, which drew $250 million in the 2025 country data, does not appear as a material presence in the 2026 equivalent. Egypt contracted from $122 million to $45 million.
Israel fell from $679 million to $153 million, reflecting both the partial-year effect and the market-specific macroeconomic and geopolitical conditions. Saudi Arabia moved from $49.4 million to $58.2 million, effectively flat, and the gap between the kingdom's sovereign-level capital commitments and the commercial venture activity captured in funding databases has not closed in the period covered by this data.
The MENA trending data in 2026 also surfaced some unexpected life sciences entries: neurorehabilitation and urinary incontinence treatment each attracted $47.8 million, neither of which has an equivalent presence in the 2025 regional data, pointing to institutional capital flowing into the region in categories outside its conventional technology narrative.
Forex and algorithmic trading platforms each drew $25 million, consistent with the Gulf's orientation toward financial market infrastructure, and SMB accounting software drew $23.5 million, a small number that nonetheless signals interest in the enterprise software layer beneath the large-platform deals that dominate the headline figures. The waves allocation in 2026 showed blockchain infrastructure at $51 million, vertical SaaS at $26.2 million, and sustainability at $9 million, all modest in absolute terms relative to global equivalents but reflecting real deal activity rather than speculative positioning.
India: The Platform Megadeal Disappeared, and the Base Held
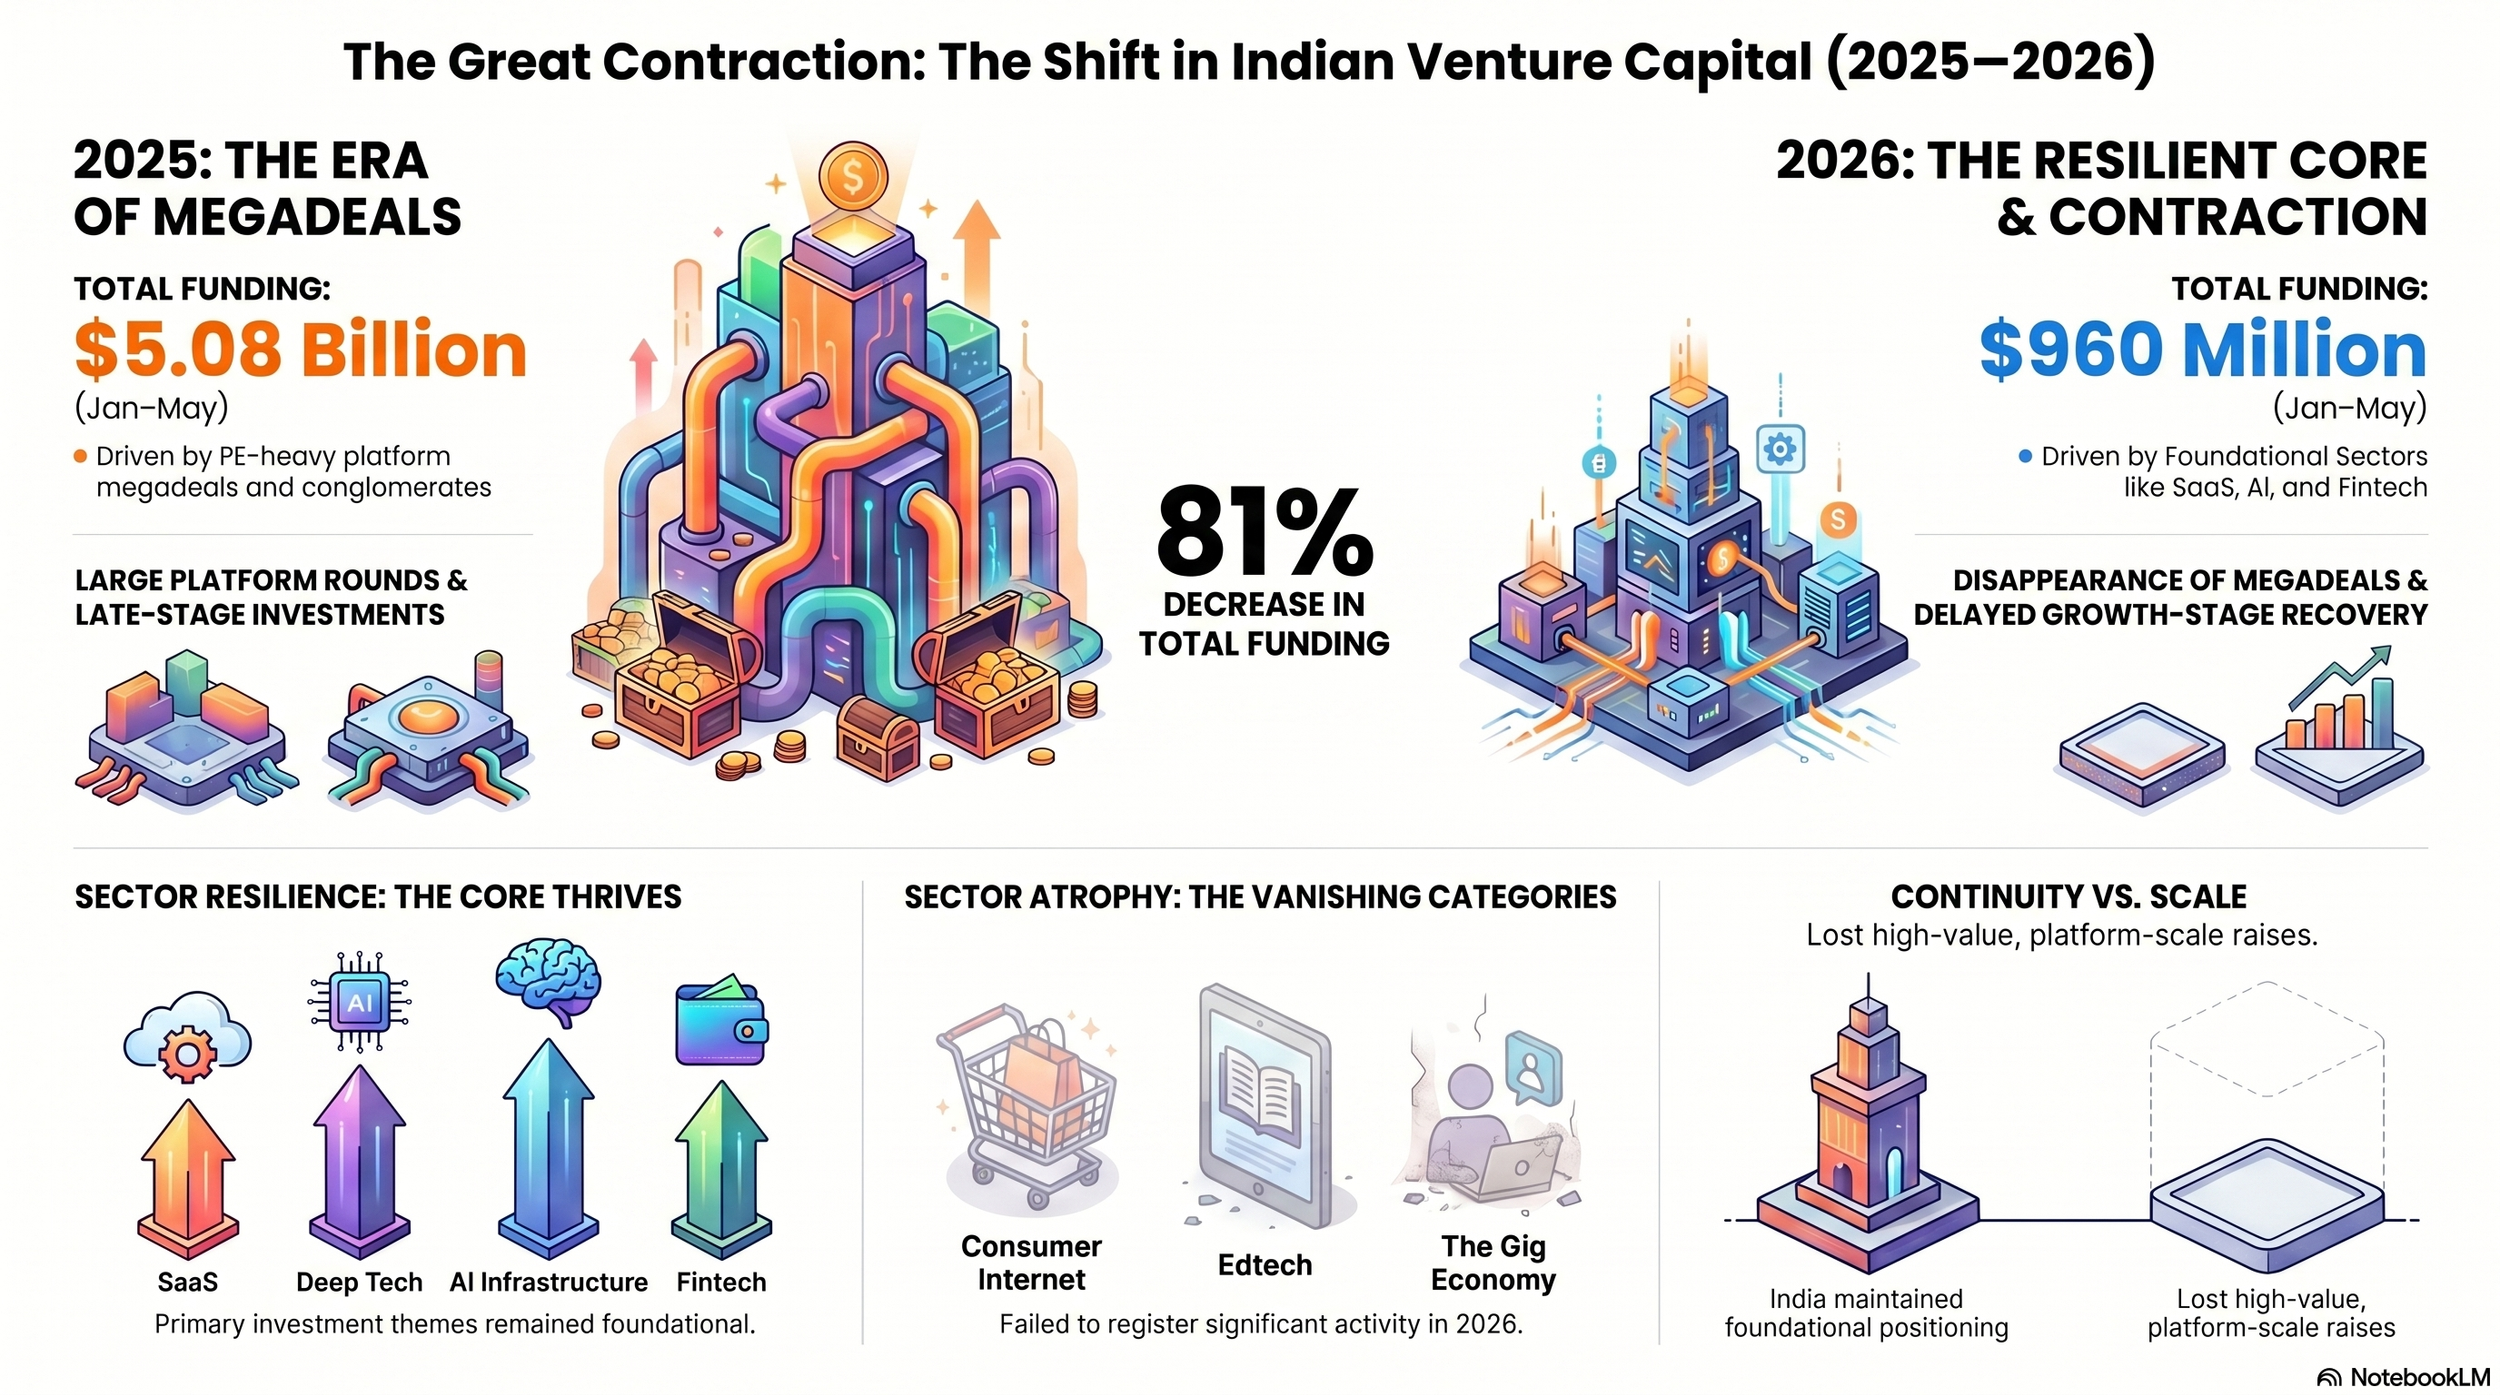
India registered $5.08 billion in the January to May 2025 data and $960 million in the equivalent 2026 period, a contraction of more than $4 billion that has a mechanical explanation rooted in the stage composition of the 2025 market and a structural explanation rooted in the slower pace of India's growth-stage recovery since the valuation correction of 2022 to 2023.
The mechanical explanation comes first: the 2025 global funding stack was PE-heavy, and India was a significant beneficiary, with large platform companies, conglomerates, and late-stage consumer tech businesses attracting institutional capital at a scale that simply does not appear in the 2026 data. The conglomerate category drew $3.54 billion globally in the 2025 tech sector data and holds no equivalent position in the 2026 breakdown, and Indian companies were a meaningful component of that allocation.
The structural explanation is that India's growth-stage market has not yet produced the replacement generation of large rounds that would restore the headline number, because the 2022 to 2023 valuation correction compressed multiples sharply for Indian growth-stage companies, several of which faced down rounds or delayed fundraises, and the recovery since has been uneven across sectors.
SaaS, deep tech, AI, and fintech, the sectors that anchor India's 2026 allocation, remained active through both periods and provide the core of continuity in the country's venture narrative, but the absence of platform-scale raises means the total sits in the hundreds of millions rather than the low billions, and the gap between those two numbers is accounted for almost entirely by the PE and late-stage instruments that were present in 2025 and absent in 2026.
What India won in the comparison, measured against the available 2026 data, is consistency with its primary investment thesis. SaaS, deep tech, AI infrastructure, and fintech appeared as the top categories in both snapshots, and the country did not lose its foundational sector positioning between the two periods, even as the headline dollar figure contracted sharply.
What India lost is easier to describe in concrete terms: consumer internet, which drove billions in Indian venture activity in the pre-correction years and contributed to the 2025 allocation through late-stage follow-on rounds, is not a significant presence in the 2026 data; edtech, which attracted substantial capital in prior cycles, has contracted to a level that does not register in the current snapshot; and the gig economy and food delivery categories that featured prominently in the 2025 global trending data, where Indian companies held meaningful positions at the $900 million level, drew their 2026 capital elsewhere or not at all.
The Sorting Is the Story
Taken as a pair, the May 2025 and May 2026 data describe a market in the process of sorting rather than simply declining, one in which the aggregate dollar figure fell, the round count fell, but specific categories attracted more capital than in the prior year, specific geographies moved against the broader trend, and specific stage configurations replaced the ones that had defined the prior period. The PE-backed late-stage market that produced $96 billion across 21,000 rounds in early 2025 was funding a wide variety of business types with a wide variety of instruments, from insurance technology to food delivery platforms to hyperlocal commerce, reflecting the diversity of a market with sufficient capital to pursue multiple theses simultaneously.
The early-stage equity market that produced $26.7 billion across 460 rounds in early 2026 was funding a narrower set of companies at earlier formation stages in verticals with direct AI or defence adjacency, reflecting a market in which the cost of maintaining broad conviction had risen, and institutional investors had concentrated their attention on the themes with the clearest near-term demand signal. That concentration is the most durable signal in the comparison: the US held its share of global capital while rotating its sector allocation toward military AI and autonomous systems; the UAE captured eightfold more capital than the previous year while the rest of MENA contracted; India held its sector core while losing its platform-scale layer; and the market did not simply get smaller between May 2025 and May 2026 but became harder about what it was willing to fund and at what stage it was willing to fund it.
